HWT History
Collaboration between the NOAA National Severe Storms Laboratory, the NOAA National Weather Service Norman Forecast Office, and the Radar Operations Center dates back to the 1980s. The partnership played a central role in data collection and forecasting for multiple field programs in the late ’80s and early ’90s. The well-established culture of cooperation has allowed scientists and forecasters to work together, developing new applications from operational data sets and transferring new technologies from research into forecast operations.
After the NOAA NWS Storm Prediction Center moved its operations to the NSSL facility in Norman, Oklahoma, in 1997, the mutual interests of SPC forecasters, NSSL researchers, and collocated joint research partners from the Cooperative Institute for Severe and High-Impact Weather Research and Operations (CIWRO, formally known as CIMMS) inspired the formation of the current NOAA Hazardous Weather Testbed. Through the years, HWT activities have ranged from daily map discussions involving imminent severe weather to loosely-related research projects involving two to three collaborators to periodic intensive collaborations.
During the last decade, the Experimental Forecast Program of the HWT (SPC-NSSL) has played a fundamental leadership role in introducing and implementing convection-allowing models (CAMs) in NWS operations. These models were first used in HWT experimental forecasting and evaluation exercises in 2004, in a series of collaborative efforts with entities including the NOAA National Centers for Environmental Prediction (NCEP) /Environmental Modeling Center (EMP), NOAA Earth System Research Laboratories (ESRL) /NOAA Global Systems Laboratory (GSL), University of Oklahoma Center for Analysis and Prediction of Storms (OU CAPS), and the National Center for Atmospheric Research (NCAR).
This inspired forecaster involvement and the development of innovative high-resolution diagnostic tools (storm-attribute diagnostics), the introduction of experimental, then operational real-time high-resolution forecast systems at EMC and GSL, and eventually the development of convection-allowing ensemble systems, which are now operational in the NWS.
Similarly, the Experimental Warning Program focuses on research, technology, and communication that may improve severe and hazardous weather warnings and societal response. The EWP is designed to mimic the operations of any NWS Forecast Office, providing the opportunity for experiments to leverage live and archived severe weather activity anywhere in the United States. During the first decade of activity in the EWP, 15 experiments covered topics including: new radar and satellite applications, storm-scale numerical models and data assimilation, total lightning use in severe weather forecasting, and multiple social science and end-user topics.
The experiments ranged from exploratory and conceptual research to more controlled experimental design to establish statistical patterns and causal relationships. The EWP brought more than 400 NWS forecasters, 60 emergency managers, and 30 broadcast meteorologists to the HWT to participate in live demonstrations, archive events, and data-denial experiments influencing today’s operational warning environment and shaping the future of warning research, technology, and communication for years to come.
HWT Timeline
1984–1985: The Preliminary Regional Experiment for Storm-Central (PRE-STORM) takes place. This exchange of ideas, support of field operations, and real-time data collection are paramount to the success of future collaborative programs.
1987: The Doppler and Lightning Exercise (DOPLIGHT) conducts real-time operational testing and evaluation of Doppler radar. The fundamental success of this effort contributes to the nationwide implementation of the Next Generation Weather Radar (NEXRAD) Weather Surveillance Radar - 1988 Doppler (WSR-88D) radar network.
1988–1989: The Mesoscale Applications Project (MAP) and STORMTIPE introduce forecasters to high-resolution mesoscale and storm-scale prediction models.
Early ’90s: Inspired by these early successes, NOAA creates a collaborative research and forecast facility in Norman, adjacent to the operational forecast floor in the Norman NWS Forecast Office. The facility is supported and staffed by NSSL, the Norman NWS Forecast Office and the Radar Operations Center.
1994–1995: The NOAA NWS Storm Prediction Center (SPC) provides forecast support for the Verification of the Origins of Rotation in Tornadoes Experiment (VORTEX). The forecasters are able to explore new data analysis software, use experimental numerical model output in the forecast process, and discuss the daily operational forecasts with leading scientists in an informal setting. This is the first experience of its kind for most SPC forecasters.
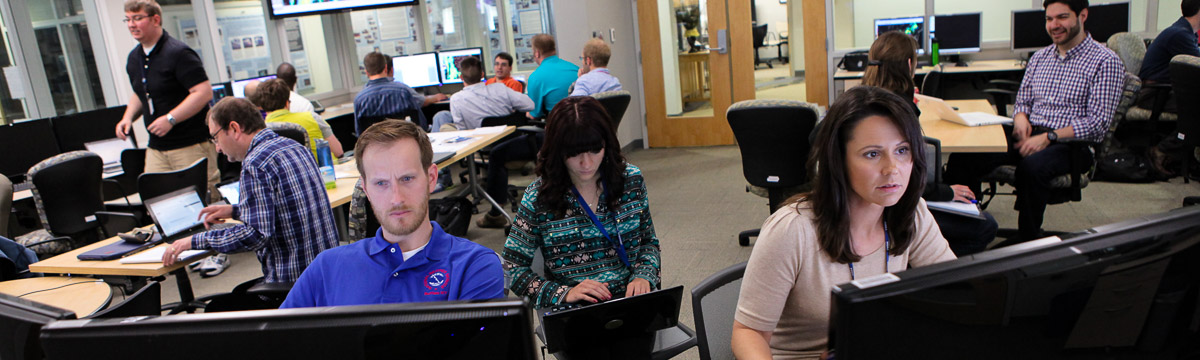
1997: Desire for more participation in the scientific process helped spur the SPC’s move from Kansas City, Missouri, to the NOAA National Severe Storms Laboratory (NSSL) facility in Norman, Oklahoma. NSSL facilities are modified to accommodate the SPC relocation, and now include an operational forecasting testbed area that mirrors SPC operations with forecasting equipment, data feed, and physical environment. There is enough workspace for up to five meteorologists during operations or 15-20 people in map discussions and/or briefings.
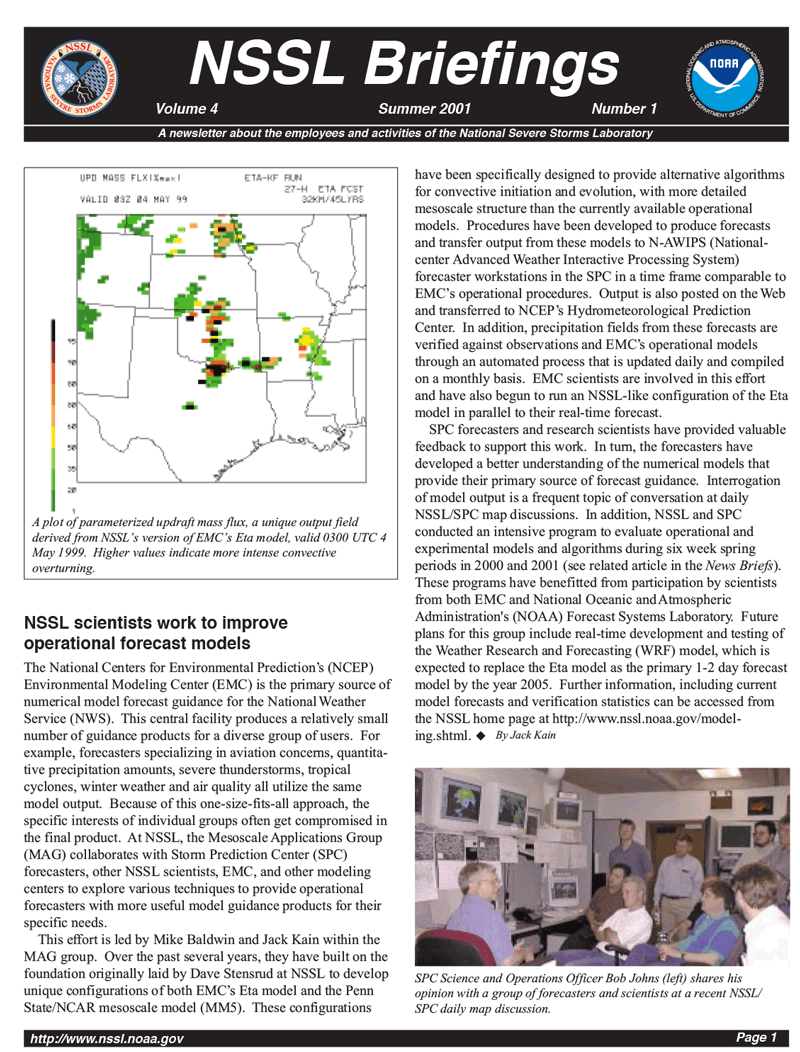
Report on the first NSSL/SPC Spring Program. (NSSL Briefings, Summer 2001, .pdf) [+]
2000: NSSL, CIWRO (formerly CIMMS), and SPC organizers develop a program inspired by the mutual scientific and strategic interests of participants. Each part of the program had a local “sponsor” — a scientist or forecaster who develops or promotes one of the tools and helps design evaluation procedures used during the program. Forecasters and numerical modelers are rewarded by the interaction — participating forecasters improve their skills at interpreting model output and modelers develop new insights into the ways weather models are being used at the SPC.
2001: Organizers plan more focused activities and make experimental forecast products a part of daily activities. These products are a main attraction for operational forecasters and help produce tangible benefits for the SPC in their quest to optimize the lead-time for severe weather watches.
2003–2005: The first real-time tests of convection-allowing models (CAMs) were conducted during Spring Forecasting Experiments (SFEs) led by NSSL and SPC, with CAM data provided by NCAR, OU’s Center for Analysis and Prediction of Storms (CAPS), and NOAA’s Environmental Modeling Center (EMC). Unlike operational models available at the time, it was found that CAMs could depict realistic storm structure, accurately distinguish storm types, and at times provide extraordinarily accurate forecasts of storm location and timing up to 36 hours in advance. Forecasters called this a “turning point in the use of model output,” and NSSL scientists were motivated to seek opportunities to move their research into operations.
2003–2005: NSSL’s polarimetric and initial multi-radar algorithms were taken to individual NWS Forecast Offices for evaluation by operational forecasters. While feedback was informative, it was often difficult for forecasters to evaluate new products and algorithms during warning operations when life and property were at stake.
2005: A proposal was submitted to begin the Experimental Warning Program (EWP) as part of the HWT to create an operational environment similar to a NWS Forecast Office. The idea was the EWP could provide a place for rapid prototyping, exploratory research, and proof-of-concept testing by embedding forecasters and researchers alongside software developers and training entities within the HWT.
2006: NSSL established a permanent experimental modeling framework, known as the NSSL-WRF, to provide CAM-based guidance to SPC forecasters and serve as a testing ground for the development of new and innovative CAM-based forecast tools. The NSSL-WRF continues to run in real-time and comprises the longest-running archive of CAM forecasts in the world. Many of today’s most widely used CAM-based forecasting tools originated in the NSSL-WRF framework.
September 2006: The National Weather Center is dedicated in Norman, Oklahoma, and thus the NOAA Hazardous Weather Testbed facility is created. The HWT is situated between the operations areas of the SPC and the NWS Norman Forecast Office within the National Weather Center.
2007: EWP During spring 2007, initial testing begins in the EWP to create experimental “threat area” severe weather warnings. EWP participants also viewed and evaluated products generated by local dual-polarimetric WSR-88D radar in preparation for nationwide deployment in 2010-2011. Participants also collected and evaluated data from the NOAA National Weather Radar Testbed (NWRT), including the first examination of the potential use of smaller gap filling radars.
2007: EFP With support from NOAA’s Collaborative Science, Technology, and Applied Research (CSTAR) program, CAPS provided the first real-time CAM ensembles for testing in the 2007 Spring Forecasting Experiment. CAM ensembles are a collection of CAMs that use different input and/or configurations to account for uncertainty, which can be large at storm scales. The success of this activity started a whole new initiative in the HWT, focused on developing and testing CAM ensemble post-processing techniques, visualization strategies, and verification methods.
2008: EWP researchers and forecasters evaluate Phased Array Radar (PAR) and gap-filling X-band radars. The first tests and analysis of gridded Probabilistic Hazard Information (PHIT) with forecasters are completed in the HWT as a possible future for severe weather warning products adding both probability of a hazard as well as the time of arrival and departure information. Forecaster feedback and verification results highlighted a need for a “first guess” calibrated probability for PHI to work.
2009: EWP The GOES-R Proving Ground involves the operational forecast community in the assessment and development of techniques for the next generation GOES satellites (GOES-R) through highlights of initial products and algorithms in weather briefings.
2009: EFP The first experimental version of the High-Resolution Rapid Refresh Model (HRRR) was tested in the HWT. Even after operational implementation in 2014, updated versions continue to be tested in the HWT framework in collaboration with colleagues at NOAA’s Global System Laboratory.
2009–2012: EWP CAPS tests the first large domain, 1-km grid-spacing CAMs in the HWT.
2010: The Multi-Radar Multi-Sensor (MRMS) system is officially recognized as a NWS Line Office Transition Project, and efforts begin to install the first MRMS operational system at NOAA National Centers for Environmental Prediction (NCEP). Experimental real-time CAMs continue to run at NOAA laboratories. NCEP concludes that CAMs are potentially "transformational" and goes on to establish their own testbeds partially modeled after the HWT.
2010: EWP This is the first year of the GOES-R Proving Ground and Risk Reduction testing in the EWP directly within warning forecaster AWIPS workstations to determine the impact on forecaster storm analysis and warning decisions. Data and algorithms include overshooting top and thermal couplet detection, total lightning detection and a pseudo-Geostationary Lightning Mapper Product, simulated satellite imagery, and a 0-3 hour severe hail probability (a preliminary version of the ProbSevere Statistical Model).
2010: EWP First year of the Phased Array Radar Innovative Sensing Experiment (PARISE) is conducted, which marks the first of four experiments examining NWS forecasters’ use of PAR data during simulated real-time severe weather and tornado events.
PARISE researchers observed forecasters' use of PAR data during simulated severe weather events. [+]
2010–2011: EFP The 2010 and 2011 SFEs featured separate sets of activities focused on quantitative precipitation forecasts (QPF) and aviation weather, which were led by Weather Prediction Center (WPC) and Aviation Weather Center (AWC) staff, respectively. Based on their experiences, both the WPC and AWC created their own testbeds to support research-to-operations (R2O) activities. Additionally, the European Severe Storms Laboratory (ESSL) and Australian Bureau of Meteorology have established testbeds modeled after the HWT.
2011–2012: EFP Forecasters examine a weather-adaptive three-dimensional variational data assimilation (3DVAR) system in the EWP as a first step toward introducing Warn-on-Forecast initiatives into operations. Forecasters found the updraft, vertical vorticity, and storm-top divergence products from blended radar analysis the most useful, but data latency, as little as even 4–6 minutes, reduced the utility of the products due to the availability of newer radar scans.
2012: EWP The use of the NWS forecaster interface, AWIPS2, in the HWT is a success. “Tales of the Testbed” weekly webinars reach a large national audience in the NWS and increase the visibility of the warning research-to-operations (R2O) efforts. NWS CWSU (Center Weather Service Units—NWS units located inside FAA traffic control centers) participants use EWP experimental products to determine how they may further mitigate hazardous weather impacts to aviation and support the safe and effective flow of air traffic.
2012–2016: EFP The Storm-Scale Ensemble of Opportunity (SSEO), a collection of operationally available real-time CAMs, was developed and tested in the HWT. The SSEO was the precursor to the first operational CAM ensemble, the High-Resolution Ensemble Forecast system (HREF).
2012: EFP Collaboration with forecasters and researchers at the United Kingdom Meteorology Office began, which have involved sharing model data, and testing of experimental Unified Model configurations.
2012: EWP The second PARISE uses AWIPS2 and retrospective recall methods to learn about forecasters’ conceptual understanding of tornado events during their use of PAR data. Extended tornado warning lead time due to the use of this rapidly-updating radar data was found.
2013: EWP An operational Lightning Jump Algorithm is first tested in the EWP. This first year incorporates total lightning data from multiple Lightning Mapping Array (LMA) domains across the United States. Forecasters also examine a polarimetric hail size discrimination algorithm and work with the NOAA NWS Warning Decision Training Division to develop best practices and training for the newly deployed MRMS system.
2013: EWP The third PARISE extends its focus to learn about PAR impacts on forecasters’ warning decision-making and situational awareness during severe wind and hail events.
2014: EWP The inaugural HWT Hydrometeorology Testbed (HMT-Hydro) experiment evaluates experimental hydrologic modeling and precipitation comparison products from the Flooded Locations and Simulated Hydrographs (FLASH) system to improve the prediction of flash flooding through real-time issuance of experimental flash flood watches and warnings.
2014: EFP After several years of testing in the HWT in collaboration with colleagues at the NOAA Global Systems Laboratory (GSL), the High-Resolution Rapid Refresh (HRRR) model became operational at NCEP.
2014–2015: EWP GOES-14 Super Rapid Scan Operations were introduced to see how the higher temporal resolution expected from the GOES-R series impacted the use of satellite data during warning operations. First examination of polar orbiting satellite data in the EWP, as Joint Polar Satellite System (JPSS) program is included.
2015: EWP This year marks the inaugural HWT experiment with emergency managers. The EMs provide feedback on their interpretation of experimental probabilistic forecasts generated in the HWT from the PHI experiment and the Experimental Forecast Program (EFP).
2015: EWP The fourth and final PARISE is conducted with 30 NWS forecasters. As part of this study, eye-tracking software is used for the first time in the HWT to study NWS forecasters’ decision-making and related cognitive processes during use of PAR data.
2015: EFP For the first time, products from a prototype, real-time Warn-on-Forecast System were generated for testing during the EFP SFE. NSSL’s Warn-on-Forecast initiative aims to dramatically increase lead times for thunderstorm hazards like tornadoes, hail, and high winds.
2015–2016: EWP The EWP collaborates with the private company, Earth Networks Incorporated, to better understand the impact of both total lightning data and decision support guidance on warning operations.
2015–2016: EWP Flash flood evaluations are moved under the Hydrometeorology Testbed (HMT) banner; The now HMT-Hydro experiment evaluates the use of Hazard Services, flash flood recommenders, and precipitation forecasts with the experimental FLASH system.
2015–2017: EWP Multiple integrated warning teams of forecasters, emergency managers, and broadcast meteorologists work together to provide an end-to-end experiment to better understand the impact of Probabilistic Hazard Information (PHI) from creation to use. Experiments examine the forecaster creation of PHI and include human factors and study human-computer interaction.
2016: EFP The Community Leveraged Unified Ensemble (CLUE) framework was established, which facilitates controlled experiments in the HWT and represents an unprecedented effort to leverage several academic and government research institutions to help guide NOAA’s operational environmental modeling efforts at the convection-allowing scale as part of the Unified Forecast System (UFS) initiative. In the CLUE framework, collaborators submitting model data to the HWT coordinate their model specifications and output to determine ideal CAM ensemble configuration strategies.
2016: EWP This year also marks the inaugural HWT Experiment with broadcast meteorologists. The broadcasters use and provide feedback on experimental probabilistic forecasts from the PHI experiment and the EFP in a mock television studio.
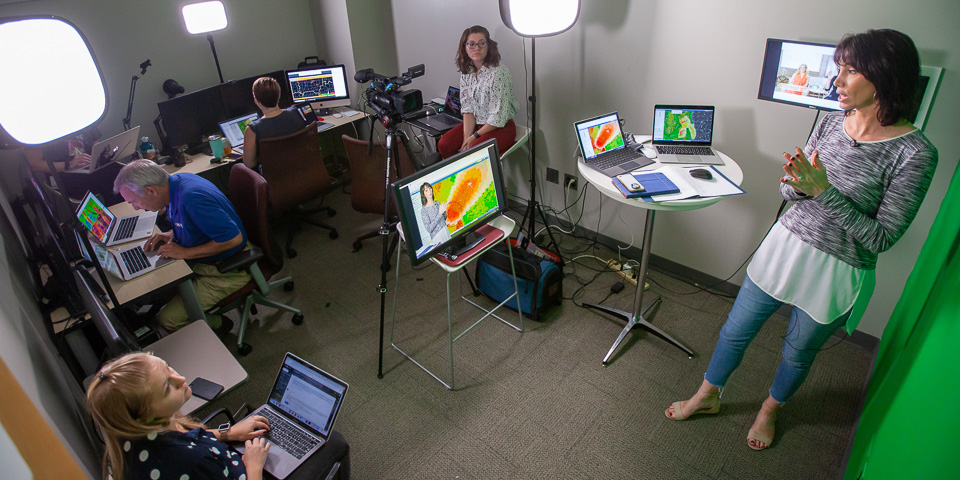
Broadcast meteorologists use and provide feedback on experimental probabilistic forecasts in a mock television studio. [+]
2017: EFP The first operational CAM ensemble for the United States, HREF, was implemented at NCEP. The HREF would not have been possible without the testing and development efforts within the HWT led by SPC and NSSL.
2017: EWP After the launch of the GOES-R satellite at the end of 2016, the HWT was the first place to test and evaluate the new Geostationary Lightning Mapper (GLM) products and visualizations as part of the Satellite Proving Ground. Due to forecaster feedback and subject matter expert evaluations, the GLM products were completely redesigned for both GOES-16 and GOES-17 for the full operational deployment.
2018: EFP The EFP HWT web capabilities underwent a significant overhaul and modernization. The model comparison page was redone to allow for flexible, intuitive, and interactive comparison capabilities and new web-based drawing tools were implemented, which facilitated a more interactive experience for participants.
2018: EWP The evaluation of the FLASH system within the HMT-Hydro experiment led to its official transition to National Weather Service operations. This was the first year standalone experiments were conducted for PHI with broadcast meteorologists and emergency managers. The broadcast experiment utilized the Oklahoma Weather Lab in the National Weather Center. The lab and experiment were complete with a chroma key wall, wireless microphones, lighting, and a camera. Two participants worked as a team, with one on the wall and one on the social media desk using a protected Twitter account to communicate to their hypothetical viewers.
2018–2019: EWP The HMT-Hydro experiment evaluated probabilistic FLASH (PRO-FLASH) data with various gridded probabilistic hydrologic outputs based on the potential flash flood severity. The Warn-on-Forecast System ensemble precipitation forecasters were introduced in case studies to investigate the potential coupling of PRO-FLASH with Warn-on-Forecast to improve flash flood warning lead times.
2019: EWP As part of the EWP, the Satellite & Radar Convective Applications Experiment provided NWS and Department of Defense forecasters, as well as broadcast meteorologists, the opportunity to evaluate new and updated products and algorithms for both satellite and radar severe weather applications. Participants evaluated a single-radar velocity-derived Azimuthal Shear (AzShear) product, the New Mesocyclone Detection Algorithm (NMDA) that utilizes AzShear, updated satellite algorithms that include data from both GOES 16 and GOES 17, and new gridded GLM products such as minimum flash area. The spring PHI Emergency Manager experiment expanded their product timeline to include three days before through the event of interest. This was also the first time that broadcast meteorologists and emergency managers were incorporated into the Hazard Services-PHI experiment and operated as an integrated warning team. The experiment evaluated both PHI and Threats-in-Motion, or rapidly-updating warnings.
2020: EWP The Hazard Services-PHI experiment tested tools for collaborating on warnings and PHI between weather forecast offices. Because of the COVID-19 pandemic, support staff and researchers had to quickly adapt their experiments to a virtual environment. The Severe Weather and Society Dashboard experiment, the first social data experiment hosted by the HWT, was conducted virtually using focus groups through Google Meet.
2020: EFP SFE organizers were forced to quickly transition the 2020 SFE to a virtual format. Although it was a formidable challenge, testbed staff were still able to conduct a five-week, full-day experiment featuring model evaluation and forecasting activities geared toward accelerating research-to-operations (R2O).
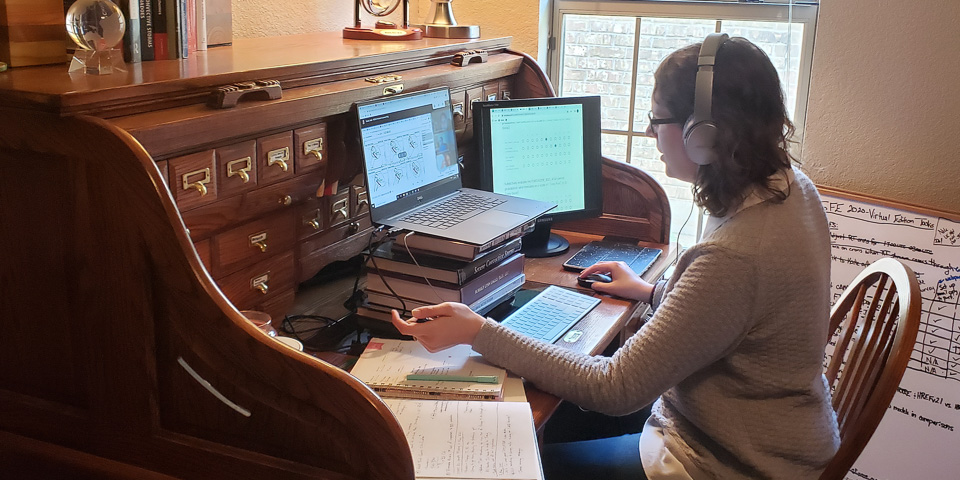
Conducting the 2020 and 2021 EFP Spring Forecasting Experiments in a virtual format removed space and travel constraints, allowing participation by the most researchers ever in 2021. [+]
2021: EWP The first Warn-on-Forecast testbed experiment was held virtually over four weeks with NWS forecasters from the Storm Prediction Center, the Weather Prediction Center, and nine local Weather Forecast Offices. For the first time, simulated cases were run using AWIPS in-the-cloud and Warn-on-Forecast data were made available within the AWIPS interface.
2021: EFP This year marked the second consecutive year of a virtual SFE. Building on experience with the virtual format, and taking advantage of having no physical space constraints, the number of participants and forecasting activities in the SFE were expanded. The 2021 SFE had the most participants ever, with 130 people, who helped generate a wealth of data and feedback on experimental model performance and forecasting activities.
2021: EWP For the first time, EWP experiments were conducted virtually using AWIPS-in-the-cloud. An updated PHI prototype tool was included in the cloud and tested a variety of background data, storm tracking, and storm motion capabilities. The first automated guidance for storm-based tornado probabilities (PHI-Tor) was tested as part of this virtual experiment. Also virtual, the annual satellite proving ground experiment included forecasters from a variety of time zones and as far away as Guam.